There were gains in the production output trend of fertilizers, dyes and pigments, chlor-alkali, other inorganic chemicals, industrial gases, plastic resins, pharmaceuticals adhesives, coatings, and other specialty chemicals.
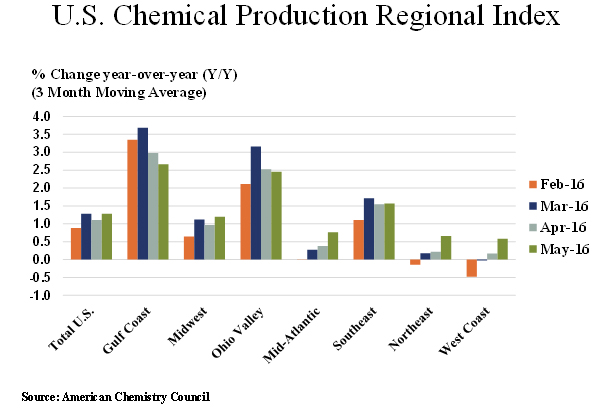
According to the American Chemistry Council (ACC), the U.S. Chemical Production Regional Index (U.S. CPRI) edged higher by 0.1 percent in May, following a 0.1 percent decline in April, and a 0.5 percent increase in March, as measured on a three-month moving average (3MMA) basis. In May, all regions posted small gains.
Also measured on a 3MMA basis, chemical production was mixed. There were gains in the production output trend of fertilizers, dyes and pigments, chlor-alkali, other inorganic chemicals, industrial gases, plastic resins, pharmaceuticals adhesives, coatings, and other specialty chemicals. These gains were offset by declines in the output trend in organic chemicals, consumer products, synthetic rubber, and manufactured fibers.
Nearly all manufactured goods are produced using chemistry in some form or another. Thus, manufacturing activity is an important indicator for chemical production. On a 3MMA basis, manufacturing activity declined for a second month in May, falling by 0.2 percent. Production expanded, however in a few chemistry-intensive manufacturing industries, including motor vehicles; computers and electronics; machinery; and aerospace.
Compared to May 2015, U.S. chemical production was ahead by 1.3 percent on a year-over-year basis, an improving trend compared to last month. Chemical production remained ahead of year ago levels in all regions with the largest gains in the Gulf Coast and Ohio Valley regions.
The chemistry industry is one of the largest industries in the United States, a $797 billion enterprise. The manufacturing sector is the largest consumer of chemical products, and 96 percent of manufactured goods are touched by chemistry. The U.S. CPRI was developed to track chemical production activity in seven regions of the United States. The U.S. CPRI is based on information from the Federal Reserve, and as such, includes monthly revisions as published by the Federal Reserve. To smooth month-to-month fluctuations, the U.S. CPRI is measured using a three-month moving average. Thus, the reading in May reflects production activity during March, April, and May.
Register Now to Attend NextGen Chemicals & Petrochemicals Summit 2024, 11-12 July 2024, Mumbai

Subscribe To Our Newsletter & Stay Updated